Using Intelli-J to Debug a Backstage Backend
At the moment I am working with Backstage which is a large NodeJS application that provides a catalog and coordinates dev-ops services for teams of developers.
The easiest way to work with Backstage in development mode is by launching the process via yarn from the command line;
yarn start-backend
…and for the front-end;
yarn start
I am often finding that I need to debug the backend and would like to use the IDE which is most familiar to me, Intelli-J. It turns out this is easy. Append --inspect to the yarn command;
yarn start-backend --inspect
As this starts, it shows some connection information for the debugger;
...$ yarn start-backend --inspect
yarn run v1.22.5
$ yarn workspace backend start --inspect
$ backstage-cli package start --inspect
Build succeeded
Debugger listening on ws://127.0.0.1:9229/70fa3200-5bea-4e53-8691-368dfc7b07f3
For help, see: https://nodejs.org/en/docs/inspector
...
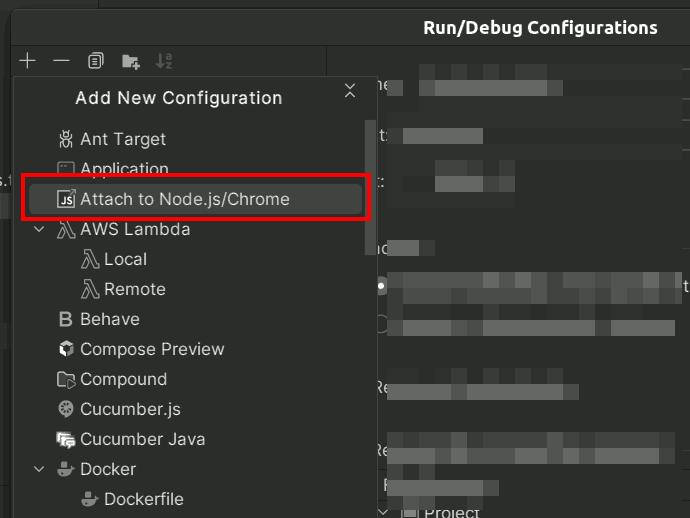
Now back in Intelli-J where you have the project open, it is possible to create a new “Debug Configuration” using the “Attach to NodeJS/Chrome” option.
Set the Host and Port options as per the URL supplied on the command line after launching yarn and the debugger in Intelli-J appears to connect to the running Backstage NodeJS process.